Overall Rank 1
Opening a food truck in Austin is surprisingly easy, but the devil’s in the details.
Rank 1

America’s modern founding as a food truck nation began in 2008 with the late-night cravings of a couple of Los Angeles-based entrepreneurs for Korean-style meat in Mexican tacos. Kogi Korean BBQ would soon gross $2 million in sales in its first year.
Mobile vending has been a part of the American culinary landscape for well over a century—"lunch wagons," or "taco trucks," took off after World War II as they followed the growth of suburbs to places where restaurants were rare.
But Kogi’s early successes spawned gourmet imitators of an altogether different breed.

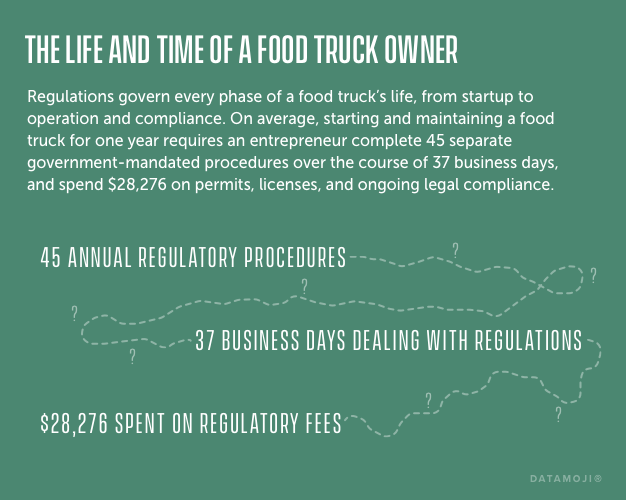
Food trucks have thrived, in part, due to low barriers to entry and high consumer demand. Yet these barriers vary greatly from city to city. In many communities, regulatory burdens and inconsistent rules that govern how, when, and where food trucks can operate are threatening to stall the growth of this emerging industry.
| Procedures | Trips | Fees Paid | |||||
|---|---|---|---|---|---|---|---|
| Number | Score | Number | Score | Costs | Score | Overall Score | |
| Denver | 10 | 100 | 8 | 100 | $811 | 99 | 100 |
| Indianapolis | 19 | 59 | 10 | 87 | $590 | 100 | 82 |
| Philadelphia | 18 | 64 | 11 | 80 | $1,778 | 93 | 79 |
| Minneapolis | 20 | 55 | 10 | 87 | $1,674 | 93 | 78 |
| Orlando | 20 | 55 | 11 | 80 | $629 | 100 | 78 |
| Austin | 20 | 55 | 14 | 60 | $1,139 | 97 | 70 |
| Phoenix | 19 | 59 | 15 | 53 | $1,540 | 94 | 69 |
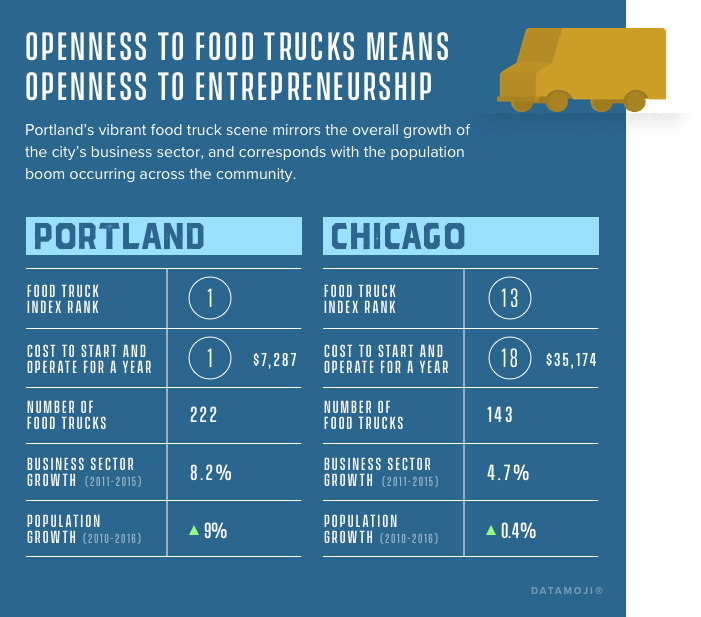
| Portland | 22 | 45 | 15 | 53 | $1,877 | 92 | 64 |
| St. Louis | 22 | 45 | 17 | 40 | $1,204 | 96 | 61 |
| Houston | 21 | 50 | 17 | 40 | $1,788 | 93 | 61 |
| Raleigh | 24 | 36 | 16 | 47 | $848 | 98 | 60 |
| Nashville | 25 | 32 | 15 | 53 | $1,343 | 95 | 60 |
| Los Angeles | 23 | 41 | 16 | 47 | $2,439 | 89 | 59 |
| New York City | 26 | 27 | 18 | 33 | $1,075 | 97 | 53 |
| Chicago | 23 | 41 | 19 | 27 | $2,713 | 87 | 52 |
| Columbus | 29 | 14 | 17 | 40 | $1,560 | 94 | 49 |
| San Francisco | 32 | 0 | 15 | 53 | $3,481 | 82 | 45 |
| Washington | 28 | 18 | 23 | 0 | $2,720 | 87 | 35 |
| Seattle | 29 | 14 | 20 | 20 | $6,211 | 66 | 33 |
| Boston | 32 | 0 | 22 | 7 | $17,066 | 0 | 2 |
| Number of Restrictions | Restriction Values | ||||
|---|---|---|---|---|---|
| Number | Score | Feet | Score | Overall Score | |
| Philadelphia | 4 | 90 | 30 | 99 | 94 |
| Denver | 2 | 100 | 320 | 86 | 93 |
| Portland | 5 | 85 | 0 | 100 | 93 |
| Orlando | 5 | 85 | 45 | 98 | 91 |
| New York City | 7 | 75 | 31 | 99 | 87 |
| Houston | 6 | 80 | 160 | 93 | 86 |
| Boston | 8 | 70 | 124 | 94 | 82 |
| Los Angeles | 5 | 85 | 700 | 68 | 77 |
| Chicago | 10 | 60 | 250 | 89 | 74 |
| Austin | 12 | 50 | 105 | 95 | 73 |
| St. Louis | 9 | 65 | 504 | 77 | 71 |
| Nashville | 10 | 60 | 546 | 75 | 68 |
| Indianapolis | 6 | 80 | 1,000 | 55 | 67 |
| Raleigh | 14 | 40 | 325 | 85 | 63 |
| Seattle | 11 | 55 | 1,120 | 49 | 52 |
| Columbus | 8 | 70 | 2,045 | 8 | 39 |
| Washington | 22 | 0 | 512 | 77 | 38 |
| San Francisco | 14 | 40 | 1,627 | 27 | 33 |
| Phoenix | 15 | 35 | 2,215 | 0 | 18 |
| Minneapolis | 22 | 0 | 1,636 | 26 | 13 |
| Procedures | Trips | Fees Paid | |||||
|---|---|---|---|---|---|---|---|
| Number | Score | Number | Score | Costs | Score | Overall Score | |
| Portland | 7 | 100 | 7 | 100 | $5,410 | 100 | 100 |
| Phoenix | 8 | 93 | 18 | 56 | $25,187 | 39 | 63 |
| Indianapolis | 9 | 86 | 20 | 48 | $20,435 | 54 | 63 |
| Columbus | 10 | 80 | 20 | 49 | $20,820 | 53 | 61 |
| Orlando | 10 | 79 | 20 | 48 | $19,621 | 56 | 61 |
| Denver | 10 | 79 | 21 | 44 | $22,751 | 47 | 57 |
| Houston | 11 | 75 | 21 | 46 | $22,746 | 47 | 56 |
| Raleigh | 11 | 72 | 22 | 40 | $22,827 | 46 | 53 |
| Seattle | 13 | 59 | 13 | 77 | $32,076 | 18 | 51 |
| Los Angeles | 10 | 79 | 21 | 47 | $29,096 | 27 | 51 |
| Austin | 14 | 52 | 22 | 43 | $22,168 | 48 | 48 |
| Nashville | 10 | 79 | 22 | 40 | $29,579 | 26 | 48 |
| Philadelphia | 13 | 63 | 24 | 34 | $25,292 | 39 | 45 |
| Minneapolis | 12 | 68 | 20 | 48 | $31,694 | 19 | 45 |
| New York City | 12 | 66 | 25 | 31 | $28,085 | 30 | 43 |
| St. Louis | 12 | 66 | 29 | 13 | $26,191 | 36 | 38 |
| Chicago | 14 | 53 | 26 | 26 | $32,461 | 17 | 32 |
| San Francisco | 17 | 33 | 27 | 22 | $28,642 | 29 | 28 |
| Washington | 16 | 39 | 32 | 0 | $29,382 | 26 | 11 |
| Boston | 21 | 0 | 32 | 0 | $37,907 | 0 | 0 |
Our report combines data published by cities and counties with survey responses from 288 food truck owners and operators to create an index that compares regulatory requirements, restrictions, and associated financial obligations for opening and operating a food truck in 20 American cities.
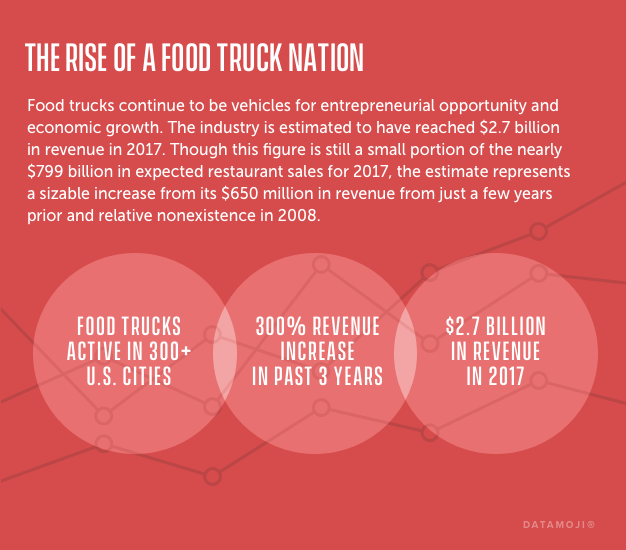
Food trucks continue to be vehicles for entrepreneurial opportunity and economic growth. But without a greater awareness of the regulatory speed bumps to mobile vending, this industry may be needlessly slowed, limiting entrepreneurial opportunity and consumer choice for millions of Americans.